
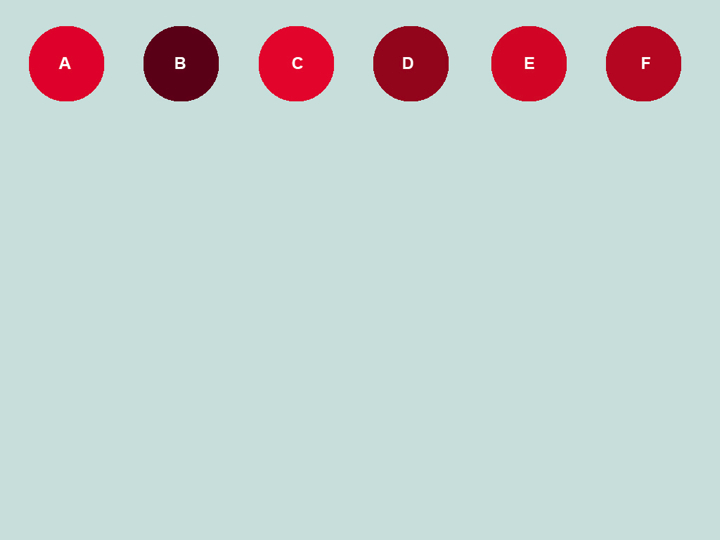
Imagine going into a fabric store and asking the clerk to bring you some red fabric. Which color would they bring to you?

You're right! They would bring you all of them.

What is red? How do we define it?

Sir Isaac Newton used a prism to split a beam of white light into what we might call a rainbow, or spectrum. This demonstrated that color is a property of light.

Which proves that if you want to understand color you need at least two copies of Pink Floyd's "Dark Side of the Moon".

When the full spectrum of white light bounces off a red tomato, only the red light is reflected back to our eye making the tomato appear red.

If you take a red shirt or a red dress and place it in a drawer in your dresser, is it still red?

Is the tomato still red when illuminated under blue light or green light? It sure doesn't look red anymore.

Here you can see our red fabric as both a pigment color on the left (the chemical color it was dyed) and as reflected color on the right, the color we see under most circumstances.

What about perceptual color? Looking at this image, the strip at the center appears to be lighter on the left and darker on the right.

But its just your perception playing a trick on you. In reality, that strip is all the same color.

Crazy right?

The color temperature of light can also impact how we interpret color. Here our tomato can be seen under both warm light and cool light. The tomato still appears red under both lighting conditions, but the shade of red is different.

We set out to build a true universal 3D real-time representation of colorspace(s). Some one hundred years ago Albert Munsel developed a three dimensional model of color based solely on visual perceptual differences. We're bringing this idea into the 21st Century.

Our software models color space(s) with three primary criteria of VALUE / CHROMA / HUE for any color and locates them in a three dimensional Cartesian coordinate space.

Value is the central achromatic axis with a zero value of black at the bottom of the model and pure white at the top.

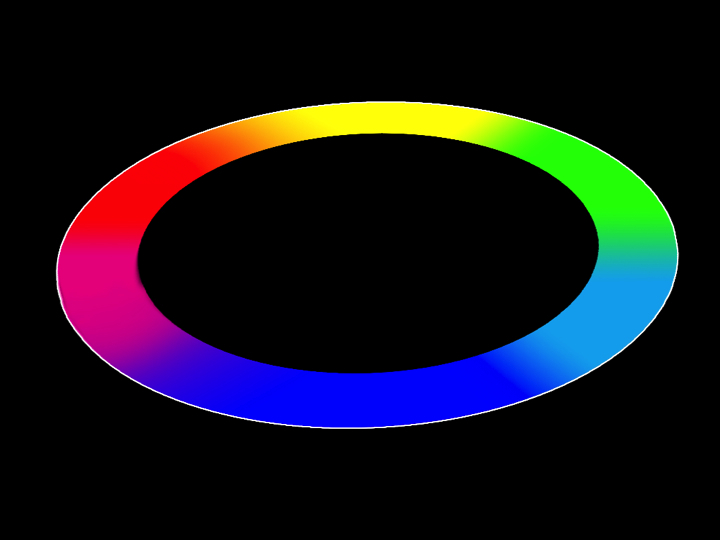
The hue is based on a degree system that rotates around the central axis.

Chroma moves outward from the central axis at differing values at every possible hue. The further away from the central axis, the greater the saturation of the selected hue.

We could now take all the reds from earlier and define each with a three numbered system and locate each color precisely.

But, you're viewing all this on our website on an rgb (red, green, blue) monitor or screen. Can you show all the visible colors on my monitor? No. The three primary phosphors that create the colors you see have a limited GAMUT. The gamut is the range of colors that can be shown with the medium you are using to view the image.

Gamut is pretty easy to explain. If you have a box of eight crayons to color with, your gamut is only the colors you can make with those eight crayons. If you have a box of twenty-four crayons, then your gamut is all the colors you can make with those twenty-four (a larger gamut). If you get a box of sixty-four crayons, you even get a sharpener, and a much larger gamut.

This chromaticity diagram illustrates gamut very well. The large "shark fin" shape that is the largest item in the chart is essentially the visible human gamut, what can be seen with the human eye.
Imagine standing on the edge of the Grand Canyon. The shark fin represents all the colors you see. The larger RGB triangle is the gamut of the colors you will see if you took a digital photo of the Grand Canyon, and the small intersection of the two triangles is the potential gamut of the postcard you might send to a friend. "Wish you were here..."

Our app can perform a real-time analysis of any image. Here the pixels of the image of the red tomato are analyzed and the results are compared to the full color model returning a color space, or gamut, for that image.
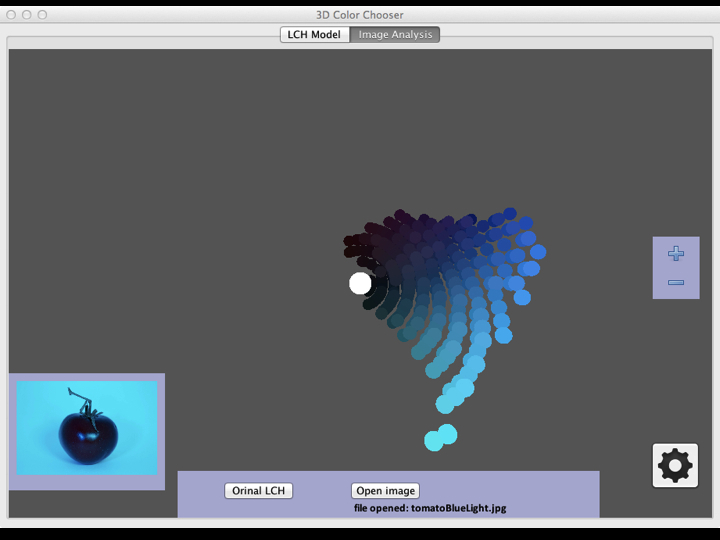
Here’s the same analysis for the tomato under the blue light…

And under green light…

We have both a theoretical cylindrical model of the visible spectrum as well as this unusually shaped model of color in RGB space. Different values of different hues can be represented with greater chronicity than some others. Interesting…

A long time ago people thought the world was flat…

But now we know different. We’d like you to stop thinking about color as a two dimensional color picker and to realize that color has three dimensions.
This is a better way to think of color.

This method of color representation is starting to look pretty dated and possibly inaccurate.

And this representation of color seems wrong too. Can you tell me what that bottom right corner of the red square is? I don’t think so….

Thanks for visiting our site. If you’d like more information or are interested in our software, please contact us. We’d love hear from you.